Debug Features
Debug Features
You can analyze the tooltip system and resolve issues using the plugin's debug mode.
Enabling Debug Mode
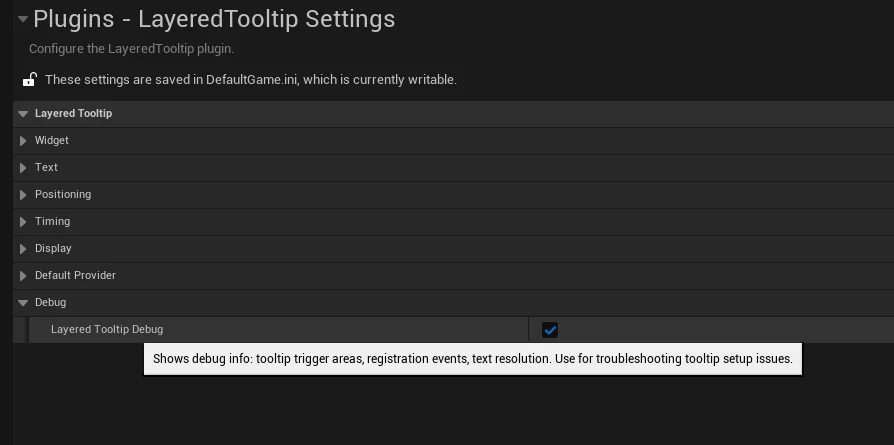
Enable in Plugin Settings:
Check Project Settings → Plugins → LayeredTooltip Settings → Layered Tooltip Debug.
Debug Features
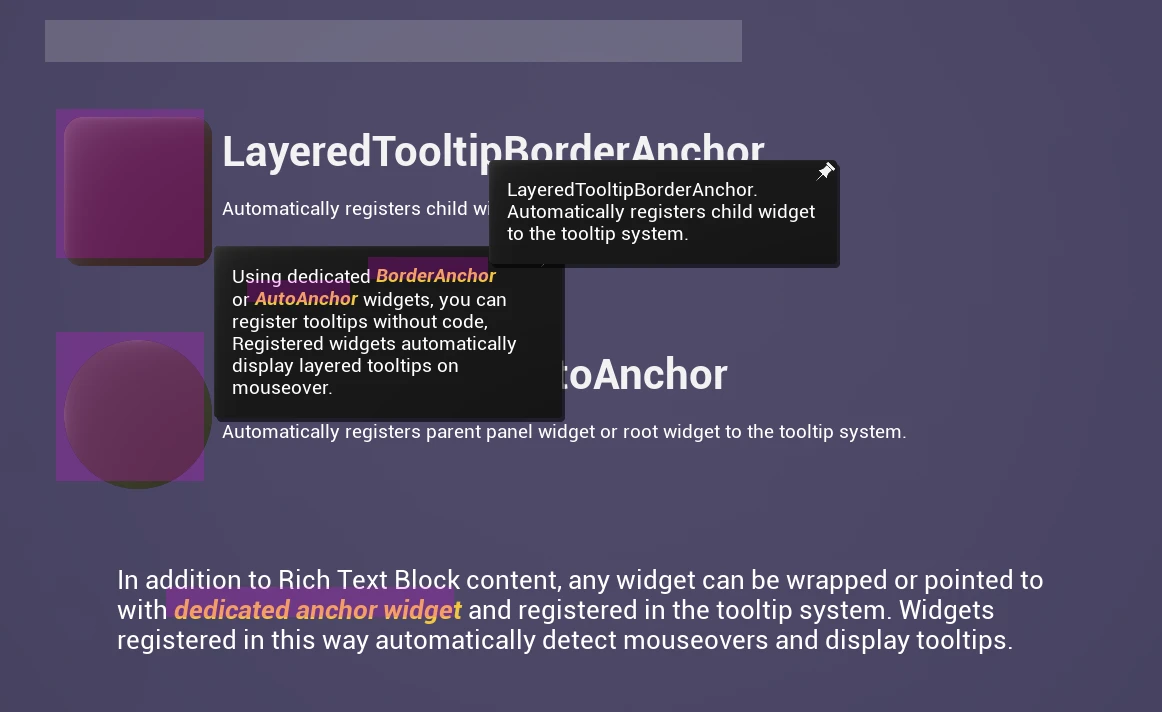
Visual Debugging:
- Highlight registered tooltip trigger areas
- Display tooltip trigger object information on screen
- Visualize active tooltip hierarchy structure
Log Output:
- Log tooltip registration/unregistration events
- Track trigger state changes
- Output metadata content
Checking Debug Information
On-Screen Debug Information:
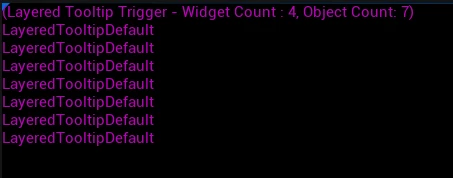
(Layered Tooltip Trigger - Widget Count: 5, Object Count: 3)
MyButton_Widget
ItemSlot_1
SkillButton_Fire
NPCInteraction_Guard
QuestGiver_Merchant
Metadata Output: When text ID is not found, raw metadata is displayed:
----Raw Metadata----
Type: Item
ItemId: sword_001
Rarity: epic
Category: weapon
Console Commands
Runtime Debug Control:
// Enable/disable at runtime in Blueprint or C++
ULayeredTooltipSettings* Settings = ULayeredTooltipSettings::Get();
Settings->bLayeredTooltipDebug = true;
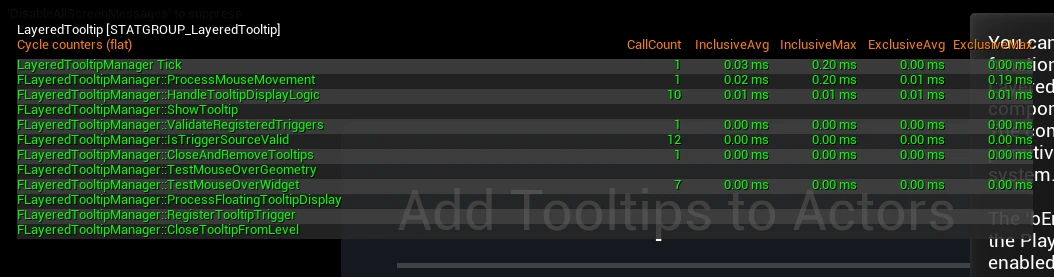
Stat Display:
-
Enter
Stat LayeredTooltipin console window
-
Check performance metrics
Troubleshooting
Common Debugging Scenarios:
- When tooltips are not displayed
- Check trigger areas in debug mode
- Verify registration status in logs
- When metadata is not properly transmitted
- Check raw metadata with debug text
- Verify key names for typos or omissions
- Performance issue analysis
- Check number of registered triggers
- Analyze frequent registration/unregistration patterns
Important Notes
- Debug mode may impact performance; use only during development
- Disable debug mode in packaged builds
- Some settings may require an engine restart